 The UK marketplace sector is responsible for a significant slice of the UK ecommerce sector, with sales of £26.2bn in 2019 accounting for just over a third of the £76bn ecommerce market in 2019. And marketplace sales are forecast to grow by 50% over the next 5 years to reach £39.3bn by 2024*. 2020’s unfortunate events have seen marketplace sales on the rise – for both the giants Amazon and eBay as well as more niche players – as online shopping for home delivery has understandably rocketed in popularity. The enforced shutdown has seen many traders expanding online out of necessity and marketplaces offer a fast and practical route to market; for example ASOS Marketplace introduced twice as many independent boutiques in April as usual. Community-driven marketplaces as varied as Etsy, Depop and Discogs had already been experiencing substantial recent growth driven by an increasing appetite for unique and sustainable purchasing, and a desire to shop directly from independent traders and artists. This blog explores further the size and dynamics of the UK marketplace sector, delving beyond just Amazon and eBay (who do account for a huge 90% of sales), with a particular focus on community-driven marketplaces to examine the winners and what we can learn from them.
THE UK MARKETPLACE SECTOR 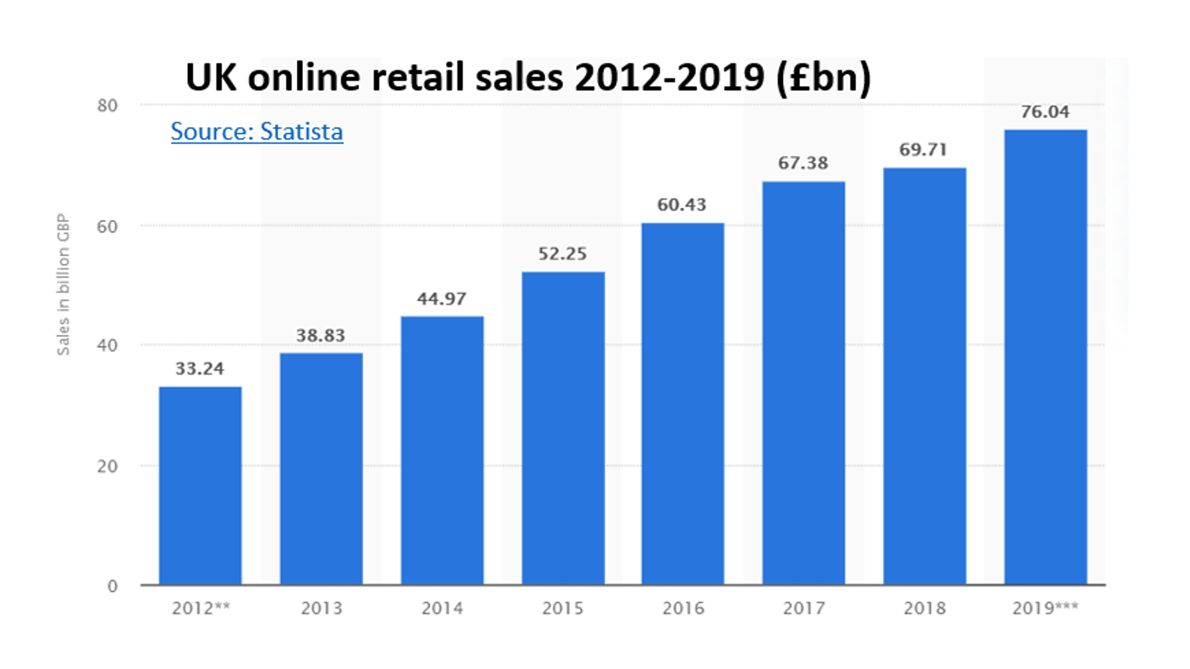 Amazon and eBay dominate the UK marketplace sector of £26.2bn, with 90% of sales but the rest of the UK marketplace sector is worth a still significant £2.6bn. With total UK online retail sales for 2019 standing at £76bn, £1 in every £3 spent online is via a marketplace. The table below shows the top 15 marketplaces in the UK, ranked by monthly visits. This is a useful starting point to assess the UK marketplace, albeit it may under-represent the reach of m-commerce first platforms such as Depop, as app traffic is not recorded. 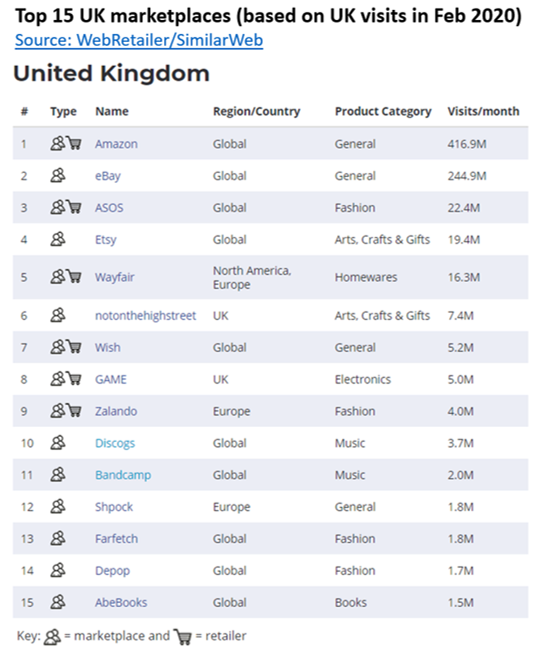 The top 15 UK marketplaces can be split into 3 distinct sectors:
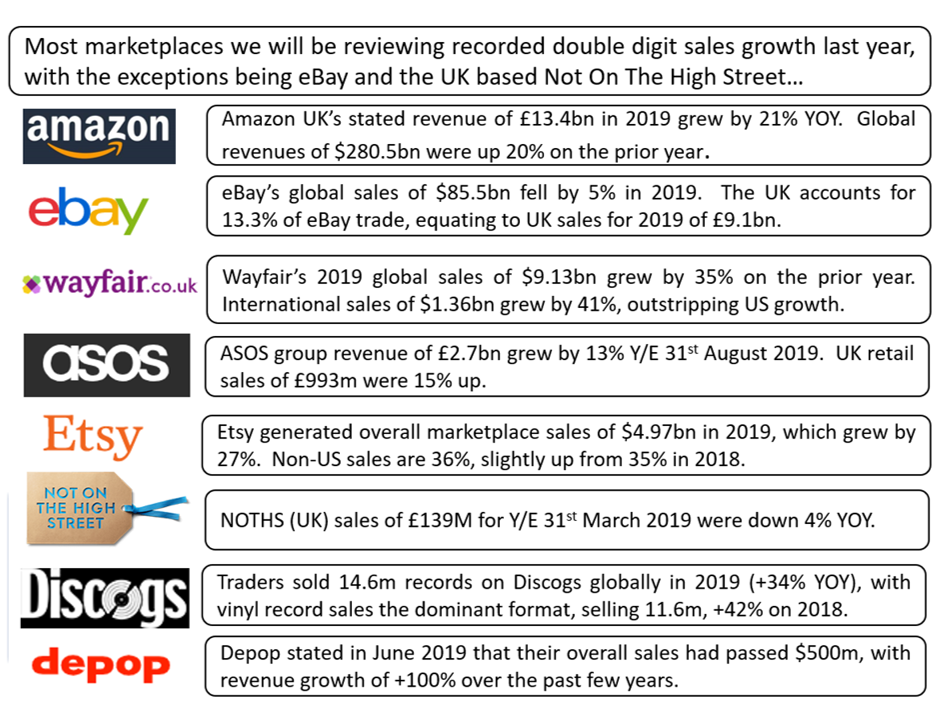 UK MARKETPLACE SIZE AND SHARE: DOMINATED BY AMAZON AND EBAY The research in the table below looks at the top 6 marketplaces by UK visits (plus Discogs, Bandcamp and Depop) and calculates the UK sales made through each marketplace, as well as the “take” or commission generated by each marketplace. As outlined earlier, Amazon and eBay dominate sales, with 90% of the £26.2bn UK marketplace sector. Established global players in Etsy and Wayfair are next in sales generated, with in excess of £250m each in 2019. The % of commission taken ranges from 8% for Discogs to 25% for Not On The High Street, with a median average of 12%. Wayfair does not disclose a take or commission rate in its annual reporting and will vary greatly based on merchant and product category. Please note that the table below is also featured on page 7 of the full "The UK marketplace sector - and the role of community" article, downloadable here. 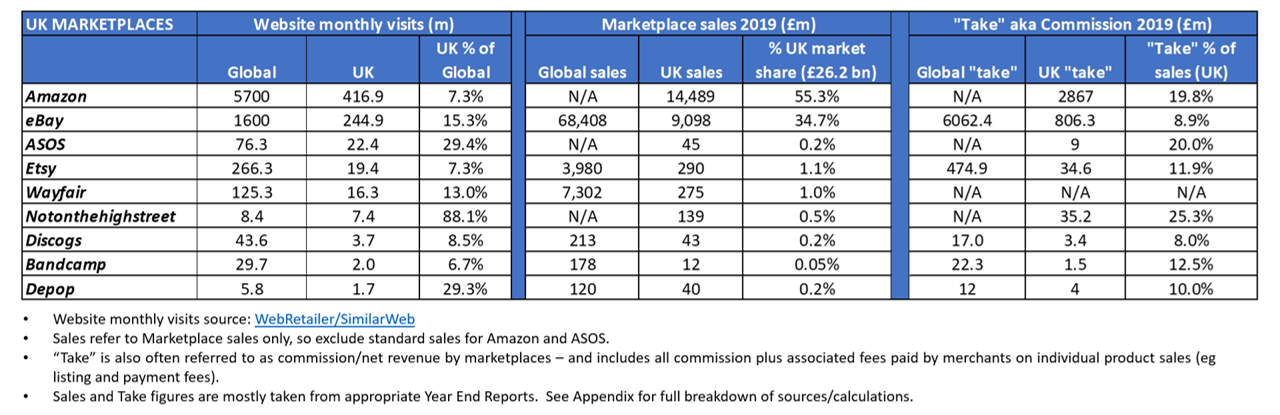 AMAZON AND EBAY Amazon’s UK revenue of £13.4bn soared by 23.2% in 2019. This figure includes all directly Amazon sold products (approx. 50% of its revenue) and commission paid by its third-party marketplace sellers but not the overall customer spend on these products, which is estimated at £14.5bn. See page 8 of the detailed article for more information on Amazon’s revenue breakdown. 7% of Amazon’s total revenue comes from Amazon Prime and it has now has 150m members worldwide, 15m in the UK. With Amazon’s convenience becoming ever more impressive – and many marketplace sellers piggybacking on the Fulfilled By Amazon (FBA) service to take advantage of this – Amazon is widening the gap in marketplace sales from the other giant of the sector, eBay. eBay’s growth has slowed in recent years, with global sales of $85.5bn actually declining by 5% YOY in 2019. The UK accounts for 13.3% of eBay’s global commission*, so this equates to $11.38bn or £9.1bn in sales. eBay’s sales do remain significant of course – 35% of all marketplace sales and 12% of all UK ecommerce sales. CATEGORY SPECIALISTS: WAYFAIR AND ASOS Wayfair and ASOS Marketplace’s category specialisms have led to recent continued growth; Wayfair’s 2019 global sales of $9.1bn grew by 35% year on year, while ASOS doubled its usual number of new sellers in April due to the Covid19 lockdown. 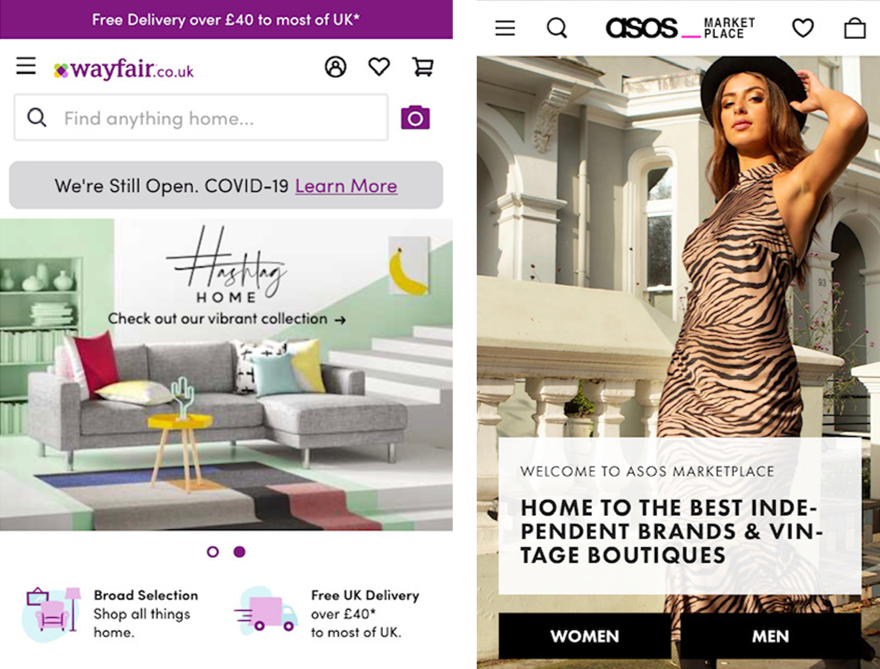 Wayfair also offers logistics services to its retailers, helping smaller players with bulky furniture items in particular. It is this service specialism – and focus on “drop ship” items - that helps to differentiate Wayfair in the market and makes them a preferred partner for furniture/home product traders. The curated nature of ASOS’ marketplace, piggybacking off its huge ecommerce specialist fashion site and brand has helped it establish its own niche. However, the fashion sector moves notoriously quickly as can be seen by the emergence and continuing growth of new concepts such as Depop. COMMUNITY-DRIVEN MARKETPLACES Depop is a buzzy example of a new community-driven marketplace, with its social mobile app first approach very different to a traditional retail website. London based but with global reach, Depop has over 15m users, most under 26 and has sold over $500m of clothing on its platform since its launch. Depop is an example of a true “m-commerce first” brand – you are strongly advised to download the app to encounter the full experience, which is very reminiscent of Instagram. You are then encouraged to follow other users and see what they’re posting via your feed; a “new” way to shop online but using very familiar methods for Gen Z digital natives. 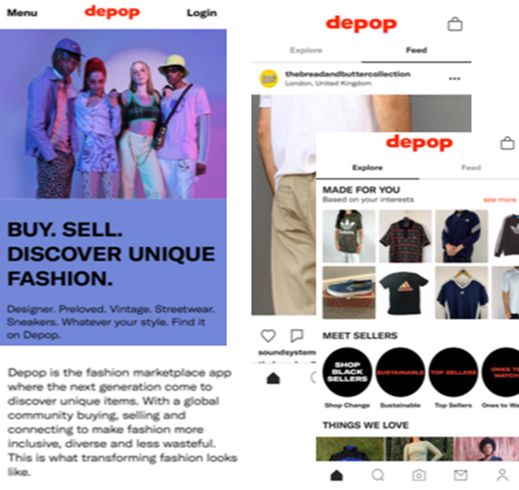 And it is Gen Z sensibilities that are increasingly interested in the more sustainable options that Depop’s “pre-loved” marketplace offers – as Depop CEO Maria Raga states: “There are reports that show that in five years resale will be as big as fast fashion…We’re extending the life of the garment, which resonates.” Etsy and Not On The High Street (NOTHS) are both arts/gifts focused community marketplaces, but Etsy’s recent sales growth has been much more impressive, with $5bn global sales in 2019 growing by 27%. Etsy’s non-US sales are 36%, of which UK is estimated at 7.3% (based on website visits share), which would equate to $348m/£290m UK sales. When reporting first quarter results in early May, Etsy also stated that sales through its marketplace globally had grown by over 100% in April, with cloth face masks an understandably large seller, but all categories seeing significant uplifts. NOTHS’s sales transacted of £139M for Y/E 31st March 2019 were down 4% YOY, but NOTHS’s active customer base did increase, with 2.57m making at least one purchase, +3% YOY. Although previously seen by some as “the British Etsy”, NOTHS has not kept pace with recent Etsy sales and has looked to concentrate more heavily on its gifting credentials recently, with new tagline “the home of thoughtful gifts”. NOTHS’s recent lack of growth will likely not have been helped by its curated approach to introducing new sellers plus significantly higher commission compared to Etsy’s simpler on-boarding process and more advantageous rates. NOTHS will be hoping their new focus on gifts will arrest this decline. A potent mixture of Wikipedia, IMDB, eBay and Pokemon for music fans, Discogs was originally established in 2000 by Kevin Lewandoski purely to catalogue dance records but now describes itself as “the world's foremost Database, Marketplace, and Community for music”. Discogs Marketplace was launched in late 2005 after customer demand and has expanded since to become a key player in the used records market, selling 14.6m records in 2019, up 34% year on year. The complementary Clear Digital research “Discogs: The Digital Success Story Of The Vinyl Revival” explores Discogs and the wider music market in much more detail – click here to find out more. CLOSING THOUGHTS Convenience is always a key factor in any shopping decisions; “location, location, location” as the old retail adage explains. Competing with Amazon’s Prime shipping options is impractical for most, so generalist marketplace traders have used this to their advantage, which has been to eBay’s detriment with their recent declining sales. However, convenience is not purely related to fast, flexible delivery; as we have seen, other marketplaces’ success has included convenient browsing and purchasing options… Instead, marketplaces as diverse as Etsy, Wayfair, Depop and Discogs have harnessed a sense of community and different online shopping experiences to build successful niche experiences serving a variety of dedicated, engaged customers with quirky/unique product selections, a strong sense of usefulness and fun, all underpinned by strong trust and ethical credentials, increasingly important for younger consumers in particular...  Product Selection: Specialising in product sectors that are not as suited to Amazon’s model, for example vintage merchandise (Depop, Discogs), bulky items (Wayfair) or artisan hand-crafted products (Etsy), has seen these niche marketplaces thrive in recent times – and with the warm feeling engendered by supporting smaller/local businesses. Usefulness/Fun: Creating a sense of usefulness or fun in the online shopping experience, especially when looking to non-retail digital presences, is also proving successful – whether that’s using Discogs’ IMDB/Wikipedia type music resources, or gaining inspiration from Depop’s Instagram style User Experience and community. Trust: When purchasing from any marketplace, the slightly faceless aspect of the ultimate seller can be disconcerting, which is again why reliability factors such as user reviews and strong trust in both the marketplace brand and overall community are highly important for both initial and repeat purchases. Ethics/Sustainability: The trend for ethical trading and purchasing sustainable products continues to be a growing concern, especially for younger consumers – Depop have stated that “there are reports that show that in 5 years resale will be as big as fast fashion”, while the built to last wares of Etsy products and second hand records from Discogs also fit comfortably into being ethical, sustainable purchases from like-minded traders. This blog is a summary of the accompanying deeper dive on “The UK marketplace sector – and the role of community” which is available to download here
0 Comments
 It’s now just 3 weeks to go till Euro 2016 kicks off in France on Friday 10th June, and while the tournament itself will have some way to go in order to match the still incredible story of Leicester City’s domestic Premier League triumph, the extra home nation interest this year will undoubtedly see passion levels run high once Euro 2016 actually starts. Summer football events such as the Euros are now also an established part of the marketing and promotion calendar for many brands – for both official sponsors and other companies – so I’ve taken a look at how some of them have so far embraced this opportunity. It was estimated that the 2014 World Cup contributed £2.5bn to UK consumer spending and it is believed that Euro 2016 will generate a similar amount, with food, drink, retail and betting sectors seeing the greatest benefits. Over 60% of pubs are predicting like for like sales increases of more than 10% through June, with the England v Wales group match on Thursday 16th June unsurprisingly highlighted as a particularly large opportunity. 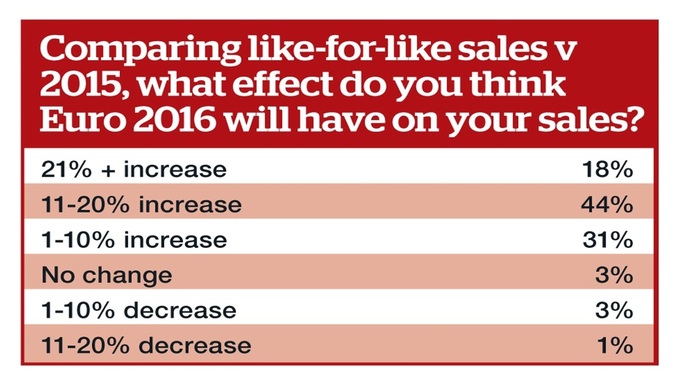 Pubs are expecting a significant sales uplift during Euro 2016. Source: Morning Advertiser/MatchPint The nature of big sporting tournaments like Euro 2016 lends itself to a variety of different objectives for brands, in particular:
OFFICIAL SPONSORS: CARLSBERG EARLY PACE-SETTERS UEFA have 10 official sponsors for Euro 2016; ranging from the usual suspects such as Adidas, Coca-Cola and McDonalds to emerging brands which won’t be as familiar to European consumers. These include the Chinese consumer electronics company Hisense and the seemingly aptly named Socar. Socar is actually the State Oil Company of the Azerbaijan Republic, so in reality this organisation is perhaps not such a natural fit for football tie-ins as Carlsberg for example.  Amongst official sponsors, Carlsberg have certainly been to the fore with their activation plans, with a range of initiatives all following the “if Carlsberg did…” strapline, seemingly both in domestic markets and pan European too. This week, Carlsberg have been trailing online a new ad campaign starring Marcel Desailly, one of France’s World Cup 98 and Euro 2000 winning heroes. “If Carlsberg Did La Revolution” will undoubtedly feature heavily in June during TV coverage, with many hidden references in there for football geeks as well. Amongst the standard ticket giveaway competitions, Carlsberg have also been using more creative methods ahead of the tournament in the UK, including Chris Kamara looking at what would happen “if Carlsberg did substitutions” and rewarding generous Tube travellers with tickets to the Euros. Other UK focused campaigns include experiential activity, with Carlsberg rebranding 19 English pubs as the patriotic “The Three Lions”. Some other selected highlights from official sponsors include:
“UNOFFICIAL” CAMPAIGNS: PREDICT THE WINNER 3 weeks out and it may be a bit early to stock up on essentials like food and drink if planning a barbecue party, but it is the perfect time for more considered purchases to enhance your Euro 2016 viewing pleasure, such as a shiny new TV. And full disclosure here: I did once buy a new TV in time for Euro 2004, so this does actually happen! However, with governing bodies such as UEFA monitoring and protecting their trademark rights to enhance the aforementioned sponsorship deals, this tends to result in some creative descriptions by the vast majority of brands that are not filling UEFA’s coffers; leading to the use of many generic campaign titles such as the “summer of sport" rather than the trademarked "Euro 2016" or similar. A couple of good examples here are provided by Currys and Argos, both of whom are offering TV promotions with a prediction element based around "this summer’s big football tournament" (aka Euro 2016). 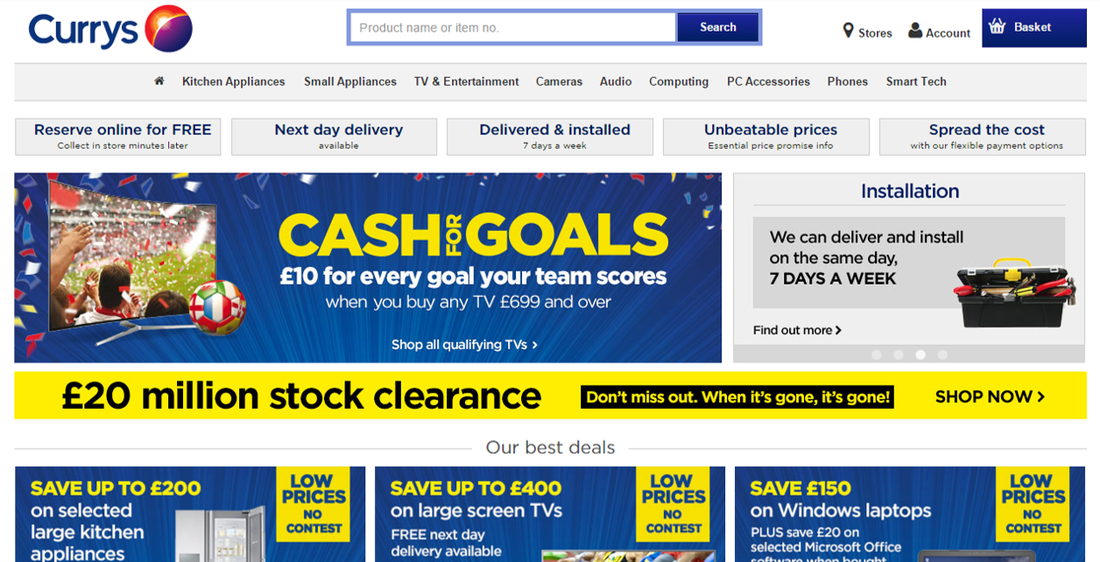 To the fore on Currys’ homepage is their “Cash for Goals” promotion, backed up by a range of accompanying media both online and offline. This is a deal that Currys have run in similar form during previous summer football tournaments, and means that should you spend over £699 on a TV, Currys are offering £10 cashback for each goal that either England, Wales, Northern Ireland or Republic of Ireland score during the tournament. Customers can pick their team and with more choice amongst British Isles teams than usual, it will certainly be interesting to see if customers patriotically pick their own home nation, or go for another team based on their perceived chances. 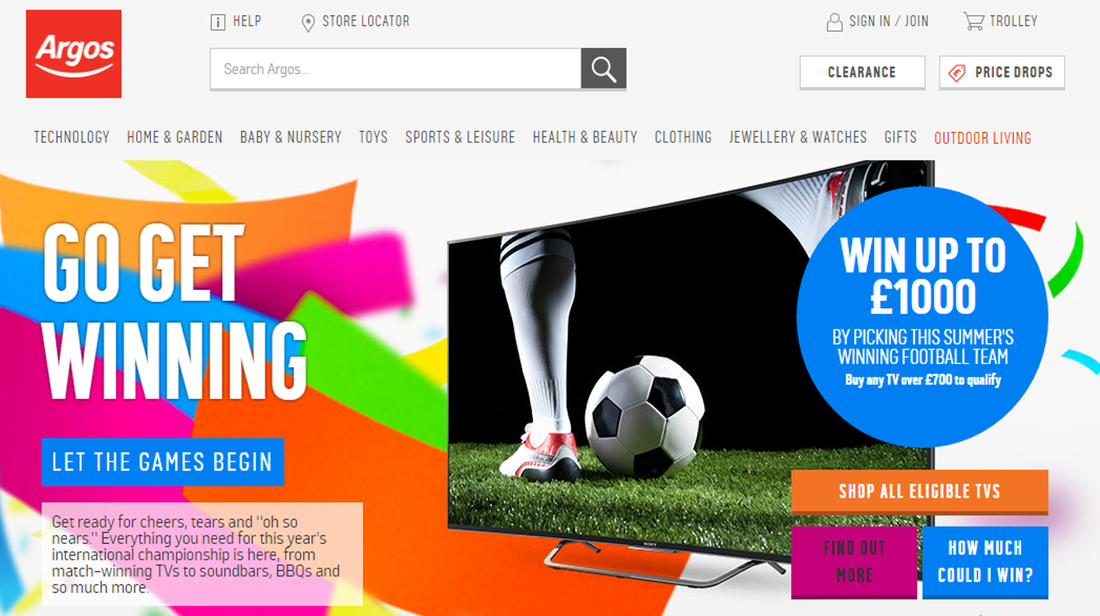 Argos are also focusing on upper end TVs by offering customers a chance to win up to £1000 by “picking this summer’s winning football team” when you buy a TV over £700 in their “Go Get Winning” promotion. Further investigation shows that for those heartened by the Leicester fairytale, you can win £1000 back if you plump for an outsider like Albania or Slovakia (or Northern Ireland/Wales), down to £100 for France, Germany or Spain. An England win, unlikely as it may seem, would net you £250 cashback. AND FINALLY… As well as official Euro 2016 sponsors maximising their activity with glossy campaigns and giveaways, plus retailers looking to sell appropriate seasonal products, multi-national sporting events generally also see a few more esoteric tie-ins as well. Expect to see some of these to the fore as the tournament approaches, but as a tasty example, the Amazon listing below provides some food for thought… 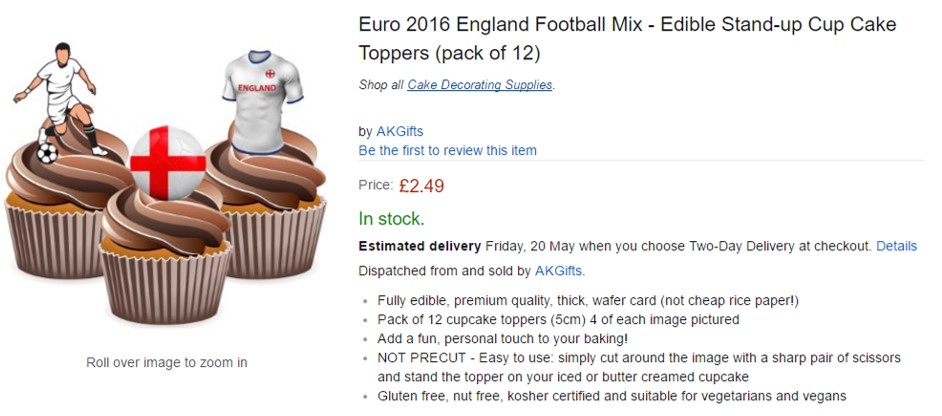 What's the most popular British TV programme? And what other big event is on the horizon? These Euro 2016 cake toppers provide an ideal baking/football mash-up 
Last Thursday (28th April 2016), I headed to Birmingham’s NEC for this year’s Internet Retailing Expo (IRX) to catch up with some old colleagues, attend a few conference sessions and generally take the temperature of the ecommerce sector. As one may expect, many of the big themes from the day were to some degree mobile centric and this blog pulls out what I considered to be 3 key overarching trends from the day:
NB: This blog is also available as a PDF file, downloadablehere. RECENT OFCOM DATA HIGHLIGHTS HOW QUICKLY SMARTPHONES ARE GAINING ON LAPTOPS AS THE PREFERRED ONLINE SHOPPING CHANNEL An ever accelerating customer shift to smartphone usage means that now is a true time of change for selling via digital channels. This change does however mean that a lot of standard ecommerce best practice (honed ever more knowledgeably over the last 10-15 years based on desktop usage and behaviour) is now steadily becoming outdated for a majority of customer journeys. Before delving into some data and insights gleaned from IRX itself, it is worth pulling out a couple of pertinent points from Ofcom’s recently issued Adults Media Use and Attributes 2016 report. One specific section looking at online shopping really shows the pace of change, highlighting that last year, 24% of users said that the smartphone is the device they most use to shop online; a huge rise from 15% in 2014, with this growth all coming from a decline in laptop preference (falling to 37% from 50% the year before) albeit laptops still remain the most used device overall. This is not the case for all ages, with smartphones preferred by younger consumers, just edging out the laptop for those in the 16-24 and 25-34 brackets. 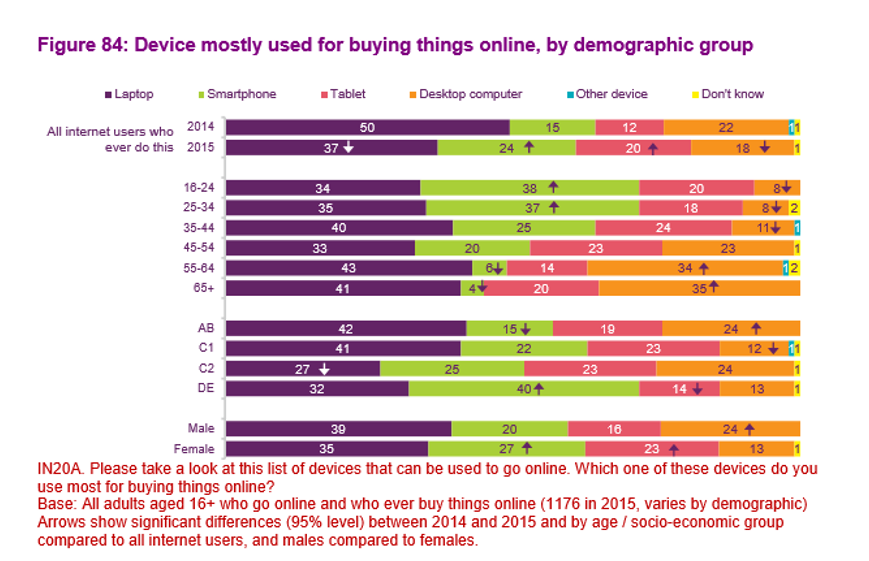
Source: Ofcom (April 2016)
So, this helps to provide some newly updated data for an ecommerce trend that is unlikely to surprise anyone. However, something that is perhaps not so well known is customers’ preference to transact on smartphone within browsers rather than via an app, a trend that is actually fairly consistent across most age groups. With mobile app strategy a source of much discussion for retailers, with many different viewpoints and strategies, this insight seems highly valuable. 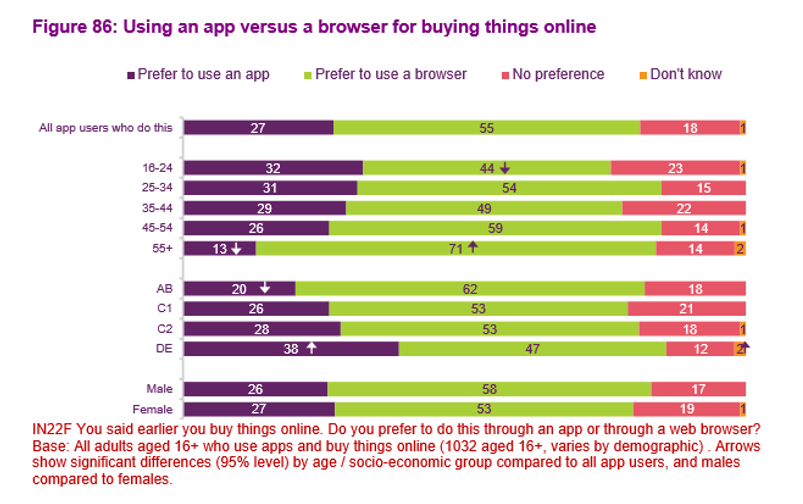
Most customers would still rather transact online with their browser than via an app. Source: Ofcom (April 2016)
THE MOST VALUABLE IRX INSIGHTS WERE SMARTPHONE RELATED Moving on to look at IRX itself, Google’s Retail Industry Head Paul Goldstein delivered the Digital Sales & Marketing closing keynote address and as one would expect, this well attended session contained some helpful insights, principally centred on the mobile experience (and how to improve your PPC AdWords campaigns of course!). Outlining that 40% of online shoppers research on mobile but then convert on desktop/tablet may have been familiar news, but the fact that 50% of customers who conduct a local search on mobile (e.g. “buy a kettle near me”) end up in store within a day was certainly a useful statistic to demonstrate the different and unique nature of smartphone shopping. Paul’s presentation then looked into the need to “Be Personal, Be Actionable and Be Measured”; important points that I’ll return to when talking about my 3 key trends. Looking at some specific retailer examples, Schuh’s Deputy Head of Ecommerce Colin McMillan mentioned that from the 15-20% of Schuh’s overall sales that were transacted online, mobile was now accounting for nearly half its traffic (48%, compared to 30% for desktop and 22% for tablet) but a lower percentage of sales; 42% of revenue due to a reduced conversion rate of approximately 1.5% compared to the 2.5-3% seen on desktop/tablet. Some fairly common ecommerce benchmarks there, but what was intriguing was the fact that 89% of Schuh mobile shoppers only interact with Schuh digitally via mobile, so the oft voiced assumption that customers use mobile early in the buying process only to ultimately convert via desktop rather than mobile (due to factors such as ease of purchase/UX and security concerns) does not seem to apply here. Rather, Schuh has a sizeable proportion of customers for whom a smartphone is their sole ecommerce experience for the whole purchase funnel. 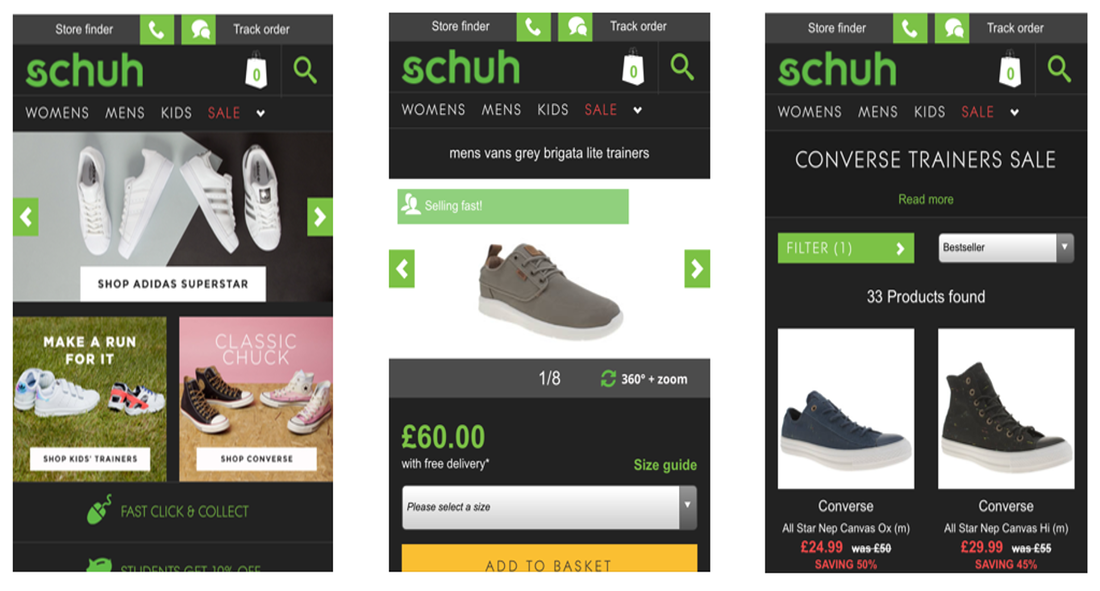
A likely lower than average age of Schuh shoppers would skew usage towards mobile to some degree, but this does also raise the question of why mobile conversion rate should be so much lower than for desktop if 9 out of 10 of mobile shoppers are exclusively using this as a digital channel. I believe that this seems to come down to 2 key factors: continuing difficulty with analysing all channels together (and understanding of the role each has to play) as well as ecommerce UX innovation proceeding at a slower pace than other mobile customer experiences, both of which I’ll explore more below. Before that though, it’s worth looking at the differences (and similarities) between desktop and mobile ecommerce, not least their different stages of maturity.
1. MOBILE COMMERCE IS STILL FAIRLY YOUNG, WITH ALL THE GROWING PAINS THAT IMPLIES
The art of designing, building and promoting standard desktop ecommerce sites is fairly well established now, with up to 20 years of practical experience, knowledge and research in this field. On the other hand, as more seasoned digital veterans will no doubt recall, despite being promised many times that the “year of mobile” was coming, it was really the iPhone’s launch in 2007 and ensuing smartphone penetration growth from the start of this decade that have led to the profound shift in consumer behaviour that has seen eMarketer forecast that UK m-commerce sales will grow nearly fourfold from £8.5bn in 2013 to a 2018 forecast of over £32bn. 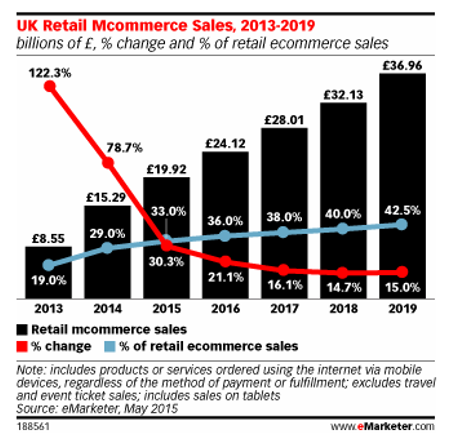
So while desktop ecommerce may now have come of age and graduated, mobile commerce is about to start primary school, so it still has a lot to learn and also is likely to keep asking many hard to answer questions, for example:
Of course, the key point to remember here is that there is no “one size fits all” approach and needs will differ from company to company, even more than with desktop due to the smartphone’s nature. With recent Ofcom research highlighting that we would now miss the smartphone more than any other device – replacing the previous preferred TV and way ahead of the computer – this simply reflects that place that our mobile now takes in our life; as well as being a supremely powerful mini-computer (and of course phone!), it is also our camera, music player, GPS, torch, clock, stepometer, games console, calculator etc etc etc. Ecommerce operations will also notice this as customers use them in very distinct ways. Having heard from Schuh that mobile is their most important channel (with 48% of traffic and 42% of sales coming from smartphones), we learnt at IRX that this is very different for Eurostar, courtesy of their Head of Digital Neil Roberts. Desktop is by far their most important digital channel, accounting for 53% of research journeys and a huge 81% of purchase journeys; smartphones account for 34% of research and 9% of purchase, with tablets making up the remaining 13% of research and 10% of purchase journeys. This is likely due to various reasons – e.g. more considered and complex purchase, older demographic – but the fact that Eurostar’s mobile experience is not yet fully optimised, albeit moving to a responsive website very soon, is also surely a factor. One final IRX experience to highlight is that of MySupermarket, courtesy of UK MD Kim Ludlow. The fourth most visited supermarket site in the UK (behind only Tesco, Asda and Sainsburys), this online comparison website actually sees a majority of its customers using it to influence in-store purchases; 35% of its customers purchase online for home delivery while 65% research online and purchase offline. The mobile nature of smartphones therefore proves a strong fit with the MySupermarket experience, with 63% of shoppers using the website on their smartphone – an adoption much higher than their accompanying app which has a much lower transaction/usage rate, prompting Kim to question that if they had known how successful the site would be on mobile “would we have built it [the app]?” Therefore, Schuh, Eurostar and MySupermarket all have quite different mobile presences (e.g. app or not, responsive or not), something to be expected in this early phase as all companies start to grow up in this area. One thing to be aware of course is both the ever increasing demands that customers have, partly driven by innovation in other sectors, a theme I’ll cover shortly.
2. MEASURABILITY REMAINS A PROBLEM FOR RETAILERS, WITH SMARTPHONE GROWTH INCREASING THE COMPLEXITY HERE
Returning to Google’s IRX presentation, their 3rd main point was to “Be Measured” and this constant striving for better analytics and measurement to aid improved decisions was unsurprisingly a key theme from just about everything I heard and discussed at IRX. Of course, this quest for improved data and insights is also not new, but the continuing march of the smartphone is making this more complex to measure as well as changing many previously established dynamics. For example, Paul Goldstein from Google stated that 90% of consumers use multiple screens when buying online, but the established “last click wins” model is still highly prevalent and the main success metric for the majority of retailers, so many optimise to this. The old ROPO model (research online, purchase offline) has been with us a while but the complexity of measuring this accurately, and then being able to utilise this data in a meaningful way to optimise marketing activity, has long been the holy grail for retailers. Google stated that 59% of customers researched online before their last in store purchase: an impressive stat that is likely lost in standard day to day digital marketing programmes. With the importance of digital (and Google AdWords of course!) often under-reported, Google have been developing further ways to track both cross devices and in store purchases. It was reported that advertisers using Google's cross-device insights are measuring up to 16% more conversions as they benefit from a much wider picture than just tracking a customer on one laptop for example. Even bigger uplifts were mentioned when looking at digital influence on store purchases, with retailers using Google Store Visits data (to help tie up the online and physical) being able to measure 4 times more overall conversions that were started digitally, and a huge 10 times more when looking specifically at mobile. 
Unsurprisingly, it is not just Google amongst the internet’s giants that is looking to help retailers understand this influence (and ultimately shift even more media spend to digital channels). For example, Facebook last month announced a partnership with Tesco owned Dunnhumby to help FMCG brands understand the impact of Facebook campaigns in store at the supermarket. It’s probably safe to say that despite making progress around marketing attribution, the industry overall has still not solved the issue of how to fully measure and assess the importance of all customer touchpoints. With mobile growing in importance (but often further up the funnel and thus not measured via the common “last click wins” method), this will be key for retailers to understand and advertising providers to help them get there. Easier said than done of course, especially with the complexity of the marketing technology landscape as I blogged about in March.
3. IS ECOMMERCE UX INNOVATION BEING LEFT BEHIND BY OTHER SECTORS?
With all this complexity to consider (measurability, multiple channels) plus the aforementioned 20 years of history to fall back on, is it possible that ecommerce is being left behind in the UX stakes by new nimbler, truly mobile first experiences as varied as Instagram, Uber, messaging services such as WhatsApp/Facebook Messenger and even Tinder? With shopping only accounting for 5% of time spent on mobile, these new interfaces are becoming the smartphone norm for customers who may not see the difference between buying a pair of shoes or a lamp with ordering a taxi or even looking for love. 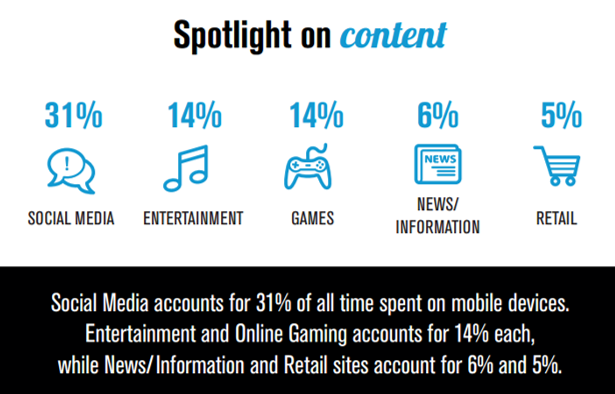
Smartphone users spend the majority of their time on social media and other entertainment. Source: Comscore (June 2015)
As an example, Tinder’s hugely simple interface is starting to provide inspiration for some fashion brands, such as Missguided, whose mobile app includes a “swipe to hype” feature clearly modelled on Tinder’s swipe left/right functionality. This allows you to build your own wish list based on a constant flow of different clothing options, alongside more standard ecommerce features, albeit even these benefit from a design that feels akin to Instagram, seemingly a wise move for this brand’s young female demographic. Of course, this type of experience will not be suited to many retailers, but it does serve as a good example of challenging traditional UX hierarchy and looking wider than just competing ecommerce sites for inspiration. 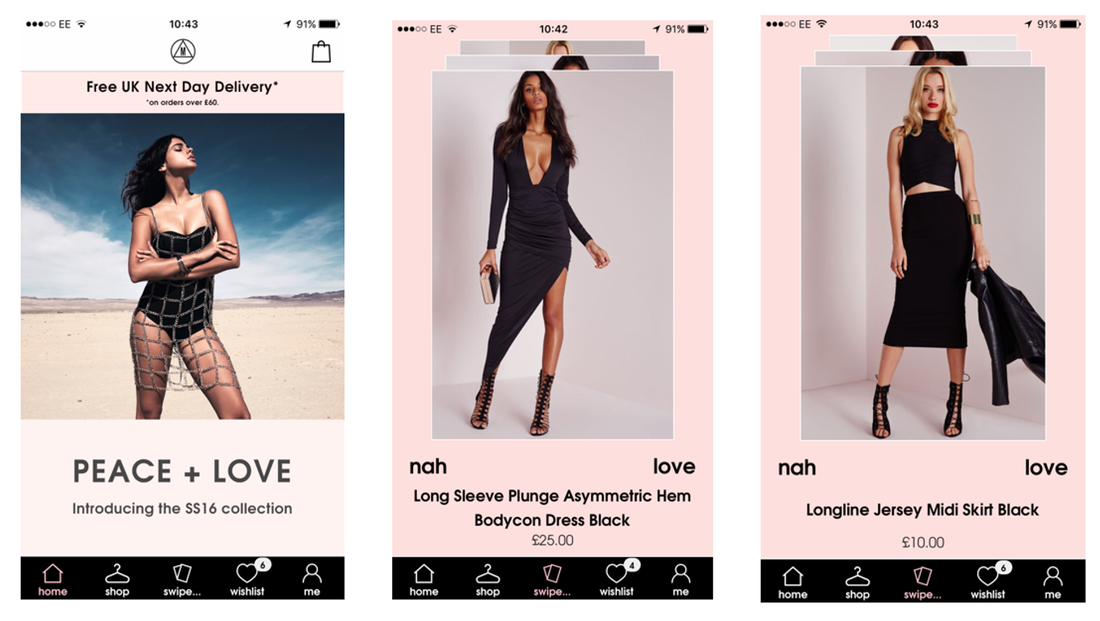
Sample screens from Missguided's mobile app, including its Tinder inspired "Swipe to Hype" section
So, in conclusion, a really stimulating day at IRX with much food for thought. It feels like the world of internet retailing continues to move forward as ever, with a real aspiration to true omni-channel capabilities. The issue of measurement continues to be a challenge (and probably always will), but a challenge with real upsides for those able to streamline their data sets into actionable insights. However, the smartphone space will remain the biggest growth priority by far for most ecommerce operations. Here, it is the different opinions and challenges faced by many retailers, coupled with the need to keep abreast of wider mobile trends and innovations, which means that mobile strategy will no doubt continue to occupy the majority of forward thinking in the coming 12 months. This week saw Ofcom release their always useful and insightful annual UK media review: Adults Media Use and Attributes 2016. At over 200 pages, there is a huge wealth of detail to take in at once, but this report can prove an invaluable one stop shop over the year for many must have stats. A good place to start is the report overview which pulls out 4 major trends, with the ever moving shift to smartphone usage unsurprisingly to the fore:
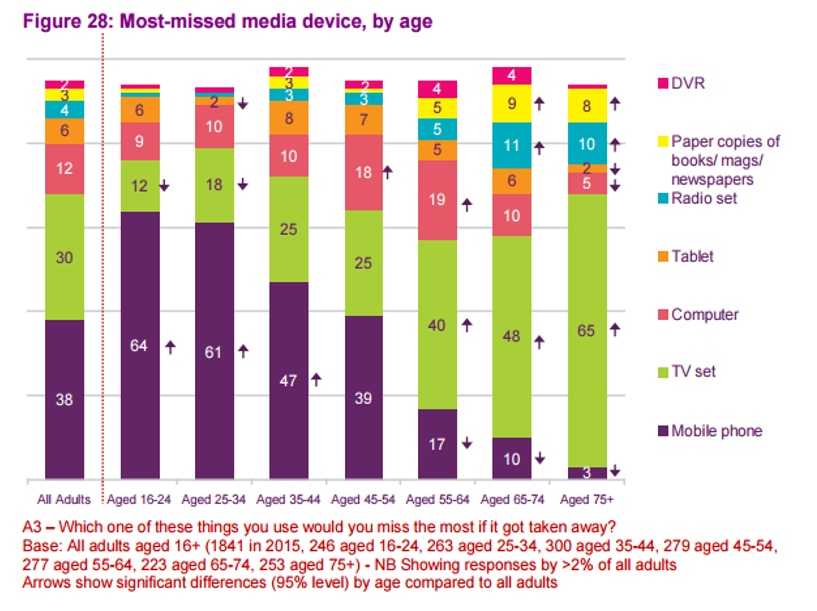 Mobile phones would now be more missed than TV by all age groups up to 55. Source: Ofcom I spent yesterday at the Internet Retailing Expo and these trends around shifting device usage were resonating loud and clear from some of my discussions there plus presentations attended; I’ll be blogging more thoughts on this next week. Returning to the Ofcom report, I’d recommend a couple of other interesting summaries:
Some diverging results statements from the internet’s big beasts this week. Although widely trailed before, it was still strangely odd to see Apple report its first fall in sales since 2003 on Tuesday, with sales of quarterly sales of $50.6bn down from $58bn in the same quarter last year. This was primarily due to a slowdown in iPhone sales (which account for 65% of Apple’s revenue) to 51.2m in the quarter from 61.2m the year before. This of course led to a wealth of think pieces on what Apple needs to do to turn this decline around (spoiler alert: it is unlikely to be the Apple Watch), while I did enjoy this “brief guide to everything that’s annoying about Apple” – my personal favourites being numbers 5 and 11. 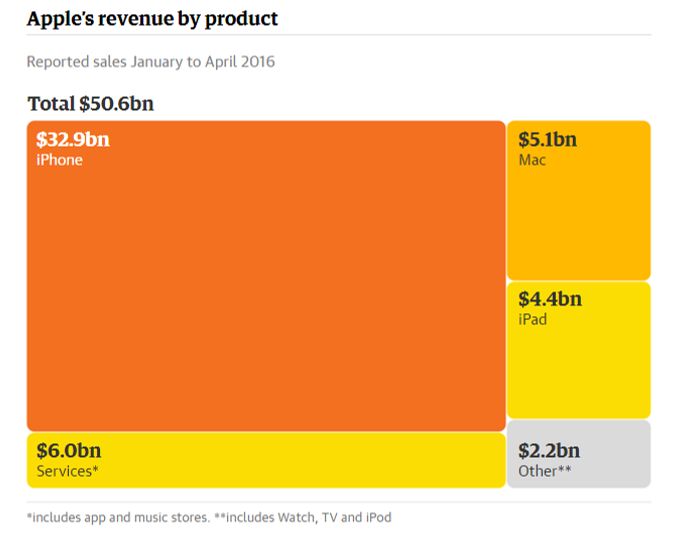 iPhone revenue dwarfs all other Apple divisions. Image source: The Guardian Meanwhile, Amazon has just posted its fourth straight profitable quarter in a row, and the largest quarterly profit in its history, prompting Wired to exclaim “Whoa, Amazon Isn’t Just Making Money. It’s Making More Than Ever”. Amazon’s Q1 net profit stood at $513m with global revenue of $29.1bn, up 28% on last year and beating analysts’ expectations, leading to a share price increase of over 12%. It’s worth stating here that Amazon spent years incurring losses as it built its huge empire (including its increasingly important AWS cloud computing arm which saw revenue up 64% YOY to $2.6bn), but has now posted ever growing profit growth for the 4 quarters of the last year; a development sure to please investors but also demonstrating that Amazon seems to be entering its next phase of maturity.
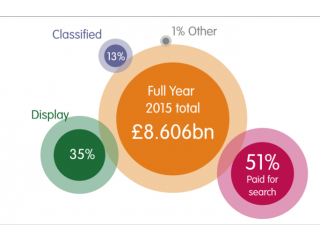
Firstly, some recent stats that caught my eye. The IAB have released their latest annual figures on digital adspend with 2015 revenue of £8.6bn, up by 16.4% YOY. With digital spend always growing year on year as it takes an ever increasing slice of the marketing budget, this is not in itself surprising; what is of note however is the fact that this is the fastest such growth seen for 7 years. This has been driven in the main by mobile spend, which was responsible for 78% of this growth, with mobile now worth £2.6bn (up 60% YOY), accounting for 30% of all digital spend. 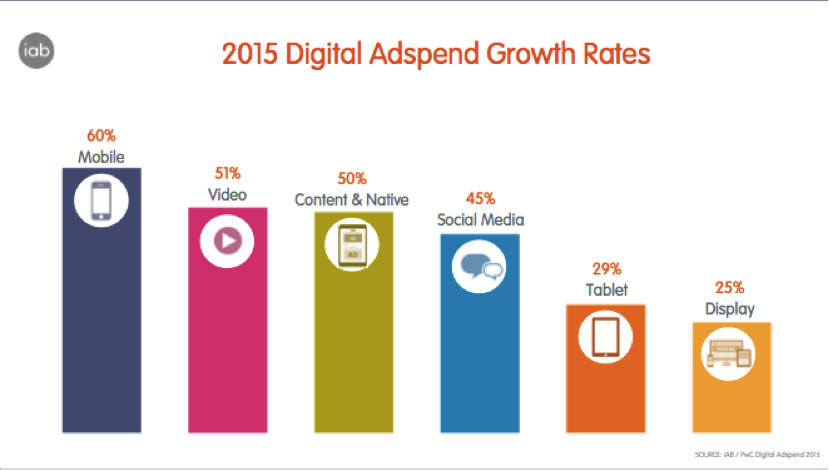
Even larger mobile growth was seen in the ecommerce sector, courtesy of the latest IMRG Capgemini eRetail Sales Index. Monthly figures for March recently released show overall online sales growing by 11%, within which smartphone transactions grew by a huge 101%. This meant that Q1 ecommerce sales increased by 15% YOY, nearly double the annual growth rate seen in Q1 2015. Larger mobile screen sizes coupled with much improved mobile shopping experiences from a variety of retailers are no doubt hoping to drive this upturn.
|
Jim ClearLead blogger and founder of Clear Digital: talking about ecommerce, digital, marketing and media. 
Categories
All
Archives
December 2020
|
||||||||||